Since the sunset of Management Reporter, many end users of the Dynamics suite have been looking towards their next reporting solution. While there are many options out there, you’ve probably heard of Jet Express and wondered whether it was worth taking the leap. While the final decision rests with your organization, hopefully, this post makes the evaluation process a little clearer.
Today, we’re going to walk through getting started with Jet Express for the first time. This is not meant to be an in-depth guide, but rather to show you how easy it is to get started building reports that can produce actionable insights. Once you’re ready to dive deeper, there is a plethora of training material available from Jet themselves at their website (see the link in the following paragraph).
As Jet Express is a free tool, you can download and test it to your heart’s content without any initial outlay. There is a step-by-step installation video under the Quick Start Training section of the page (Video #3). Once Jet Reports is installed and configured, you’ll notice a new Jet tab in Excel.
We’ll build a quick report in Jet that allows you to see the current balance for all customers at a glance. This could be useful, for instance, when reviewing customer credit limits.
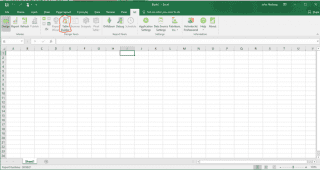
- After opening Excel, navigate to the Jet tab and click Table Builder – this will open the Table Builder window in Excel:
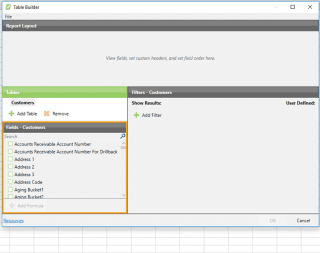
2. Click “add table,” and then select customers:
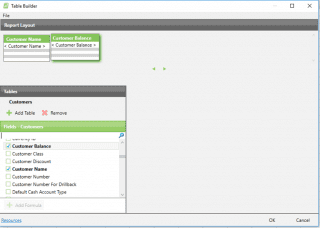
3. Check the boxes next to Customer Name and Customer Balance:
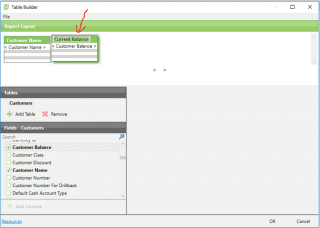
4. Although Customer Balance is fairly explanatory, we’ll change the title to Current Balance, so that the word Customer isn’t repeated twice in the report. Click the header above Customer Balance, and in place of Customer, type Current:
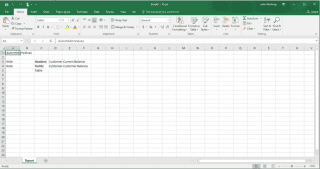
5. Click OK on the Table Builder window. Once you do this, it will bring you back to Excel, and you’ll have a worksheet that looks something like this:
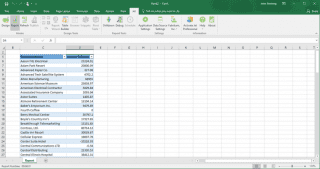
6. Click on the Jet tab again, and click the Report button over on the ribbon. This will run the report, and you will get a page that looks something like this:
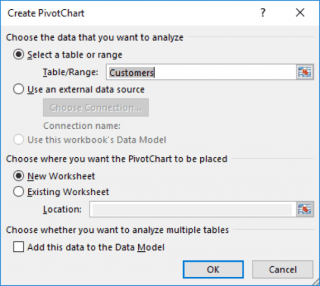
7. Now, click any field within your newly created report, and then click the PivotChart button on the Insert tab:
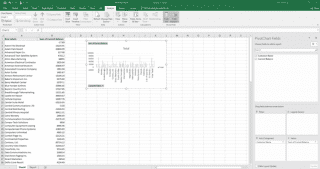
8. This will bring you to the Analyze tab. In the PivotChart section on the right, go ahead and check both Customer Name and Customer Balance for inclusion – the chart is built-in real-time as you do.
9. Now, using built-in Excel functionality (the true beauty of Jet Reports), let’s make the report look a little prettier. Select the Design tab in Excel, and select the first option on the second row under Chart Styles:
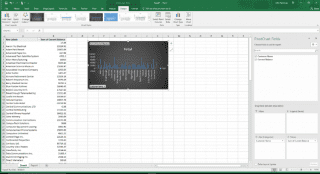
10. Next, let’s make the customer names a little more legible. Select the Switch Row/Column button:
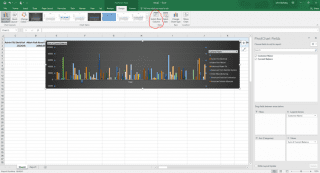
11. To get a better view of the data, the final step is simply to pull down the lower border of the chart to expand the data visibility. When the report looks good to you, go ahead and hit the Refresh button on the Jet tab to grab the latest data from Dynamics GP. When you mouse over one of the bars on the graphic, it will tell you the customer name and the current balance. You now have a quick and easy graphic to refer to whenever you wish to know who is carrying a high balance in Dynamics GP:
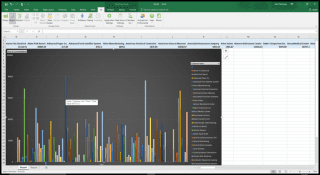
To recap, this is just a short demo to show you how easy it is to get started in Jet Reports. Once the program is installed, it should take you about 15 minutes or so to get an easy report such as the above set up and running data. Any time you want to pull in the latest data, all you have to do is click the Refresh button on the Jet tab.
As mentioned above, the people over at Jet Reports have put together some excellent resources to deepen your Jet Express experience. The link below has some outstanding instructional videos to get you going from installation to multiple-table reports. These videos take you step-by-step through the process so that you can follow along with the trainer in your system.
JOHN NORBERG | Business Software Consultant
After working a variety of jobs through college, from dishwasher at an Italian café to gravedigger and caretaker at a cemetery, John graduated from North Dakota State University and Minnesota State Community Technical College with degrees in Philosophy and Information Technology. In 2014, John began working as a Support Engineer at Microsoft in Fargo, ND, the birthplace of Dynamics GP. He discovered a passion for delivering excellent customer service, and he often lead the team in cases resolved and positive feedback. After two years working Technical Support for GP, John accepted a position at KTL Solutions as a Business Software consultant. Unlike his previous position which had afforded few personal meetings, the deep interaction with clients at KTL Solutions has allowed John to identify and analyze their problems, leading to the implementation of solutions suited to their individual needs.


